
How to View Reports
The Reports feature allows Admins and Owners to view high-level insights about activity across their organization.
Table of Contents
- Who Can Access Reports?
- How to Access Reports
- Using Reports
- Exporting Reports
- Additional Notes
- Feedback
Who Can Access Reports?
Reports are only available to:
- Owners
- Admins
How to Access Reports
- Log in to your account
- Click the drop-down arrow besides your names
- Open the Reports tab
Using Reports
You can explore reports in three ways:
- Templates: Use pre-built reports for common insights, such as daily new clients, sessions by month, clients by tag, active client trends, usage by team member, and caseload per user.
- Build your own: Create custom reports based on your needs.
- Build with AI: Generate reports using natural language prompts.
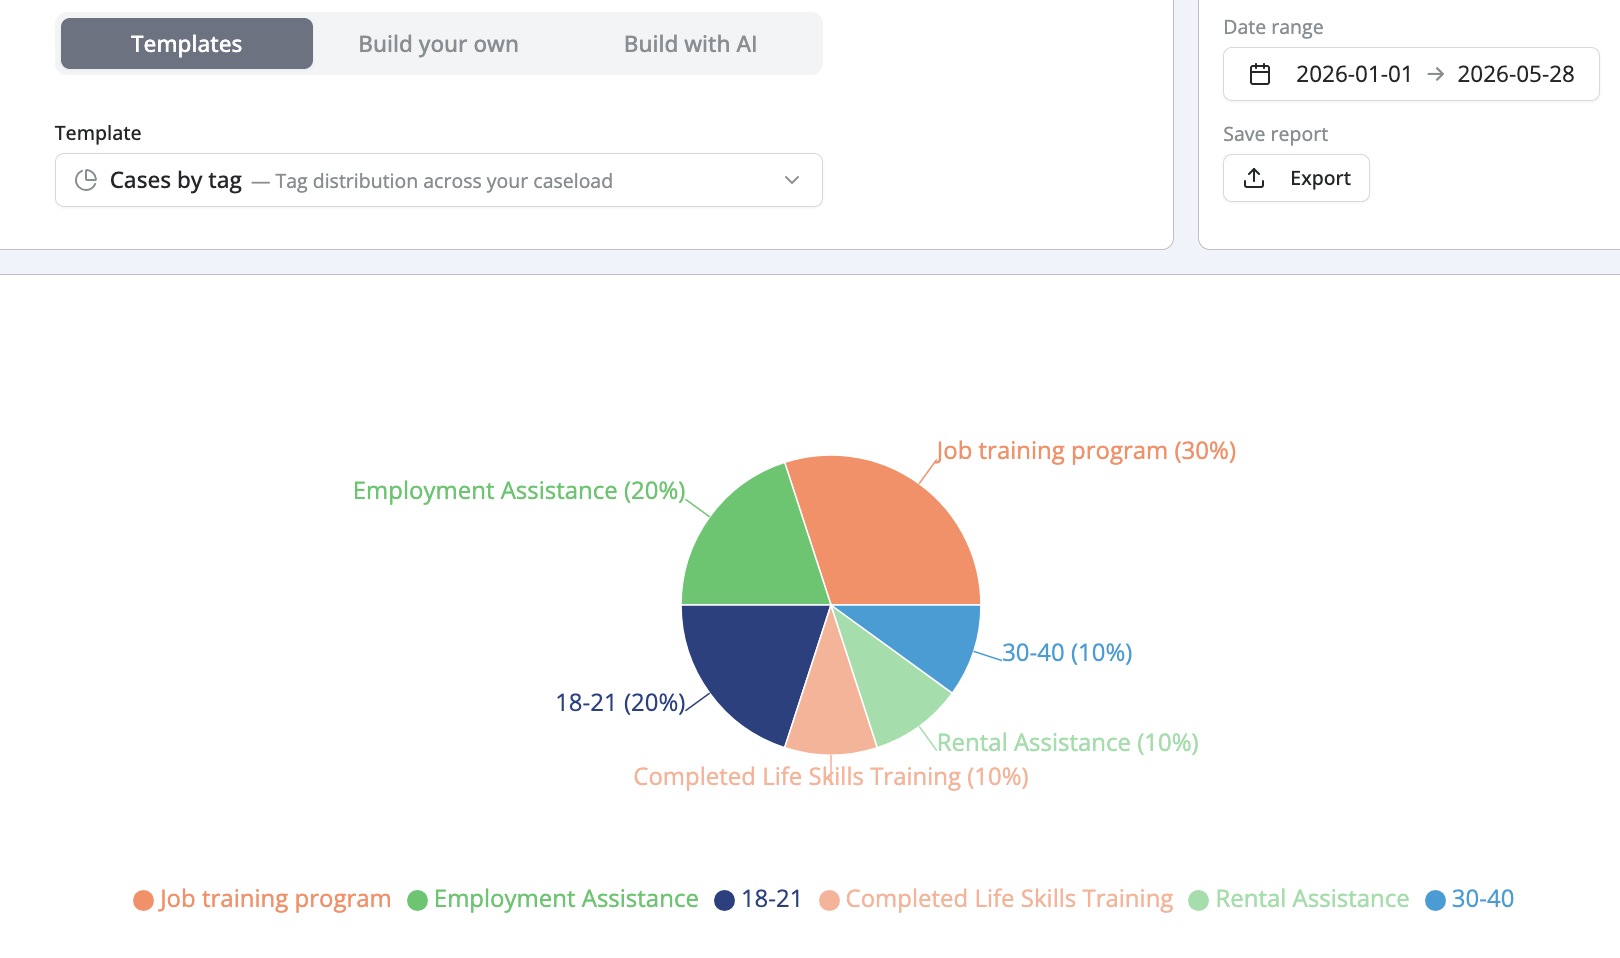
Select an option and adjust the date range to begin exploring your data. An example Cases by Tag report is shown below.
Exporting Reports
To export a report:
- Select the report and date range you want to export
- Click Export
The report downloads for use outside Notehouse. Export options may include PDF, PNG, or XLSX, depending on the report type.
Additional Notes
- Click Details on a report to view the underlying information. For example, if you select the Daily New Clients template for the first week of the month, Details shows the clients added during that date range.
- Data shown will reflect activity within the selected date range.
- Some reports may depend on how your organization structures clients, tags, and usage.
Feedback
For reports-related product feedback, you are welcome to use the feedback form.
For questions, contact us at support@getnotehouse.com.